A structured analytical examination of the small-cap segment — SEBI classification, growth mechanics, structural risks (liquidity, governance, cycle sensitivity), retail vs. institutional participation dynamics, and a five-dimensional evaluation framework.
89.2% of Indian F&O traders lost money in FY2022 (SEBI 2023). ₹1.81 lakh crore in aggregate retail losses over 3 years. An analytical deep-dive into leverage, behavioral biases, and the market structure mechanics behind retail trading losses.
₹1 lakh in 2005: Gold → ₹15.7L (14.8% CAGR), Equity → ₹11.3L (12.9%), Real Estate → ₹4.4L (7.7%). With animated 20-year chart. NSE, RBI, NHB RESIDEX data.
A data-backed investigation into global oil supply, India's 87% import dependency, the Russia pivot, and every major oil shock since 1973. IEA, RBI, DGCI&S sources.
How banks manufacture money through fractional reserve, the NIM spread explained with real India data, securitisation mechanics, and India's credit boom decoded with HDFC, SBI & Bajaj Finance.
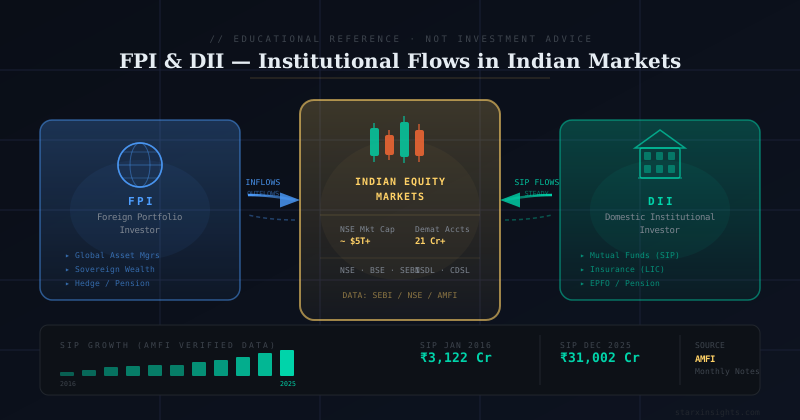
Who are FPIs and DIIs, what drives their flows, and how to read NSDL, SEBI, AMFI data. All figures historical, all cited from primary official sources.

How Satyam, Kingfisher, and IL&FS could have been avoided. A visual guide to Income Statement, Balance Sheet, and Cash Flow with a full model walkthrough.
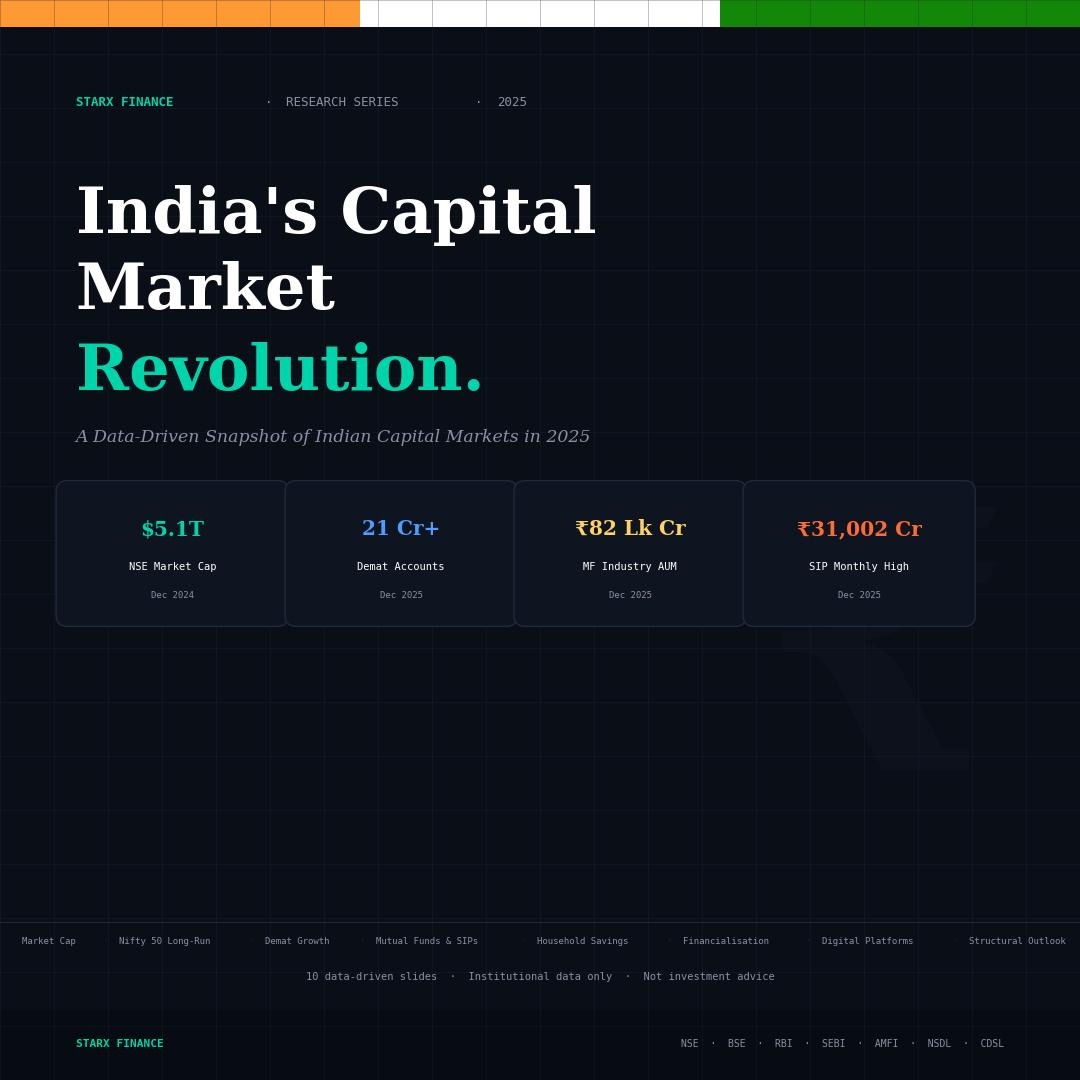
A 10-slide institutional-grade research carousel covering market cap ($5.09T), Nifty 50 performance, demat account growth (21.6 Cr), MF industry (₹81 lakh crore AUM), and household asset allocation.
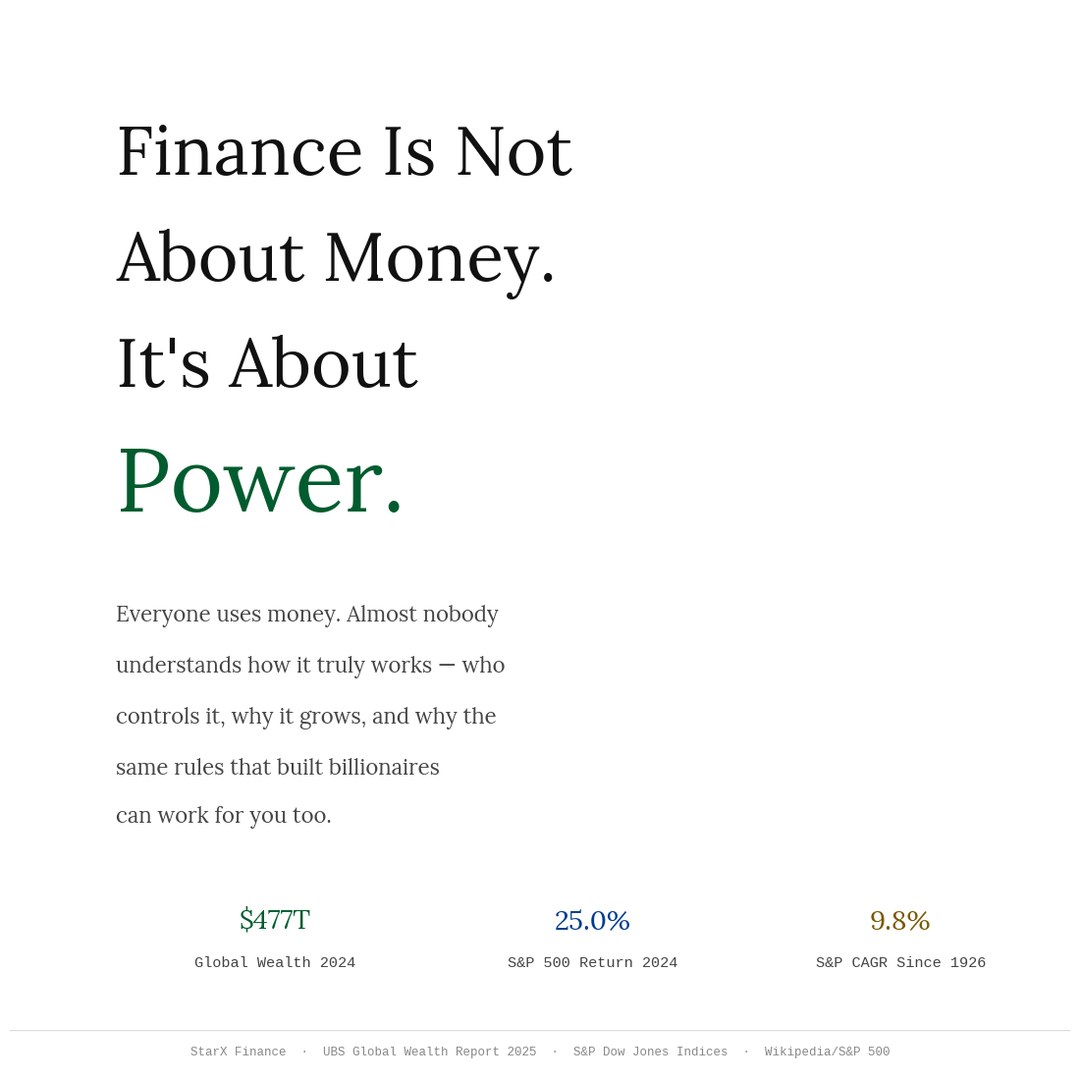
Global wealth distribution ($477T, UBS 2025), compound interest, S&P 500 long-run returns, and US inflation trends. Verified data from UBS, BLS, S&P Dow Jones, and FDIC.